Does someone have any idea why do we see an active token at a user task in Camunda cockpit when the BPMN error thrown by the user task’s end listener successfully caught and redirected via boundry error event in the process flow. Please find the view in the cockpit and audit logs attached
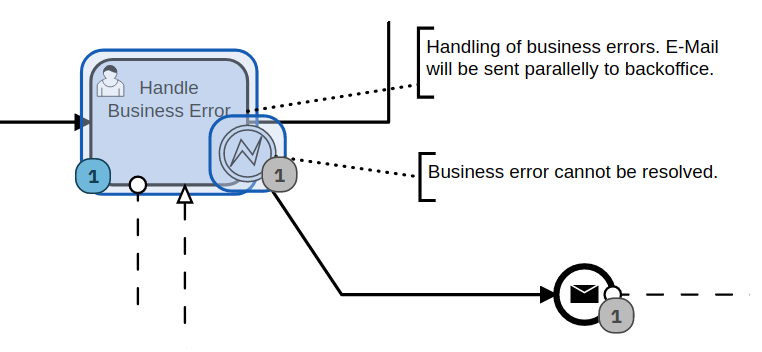
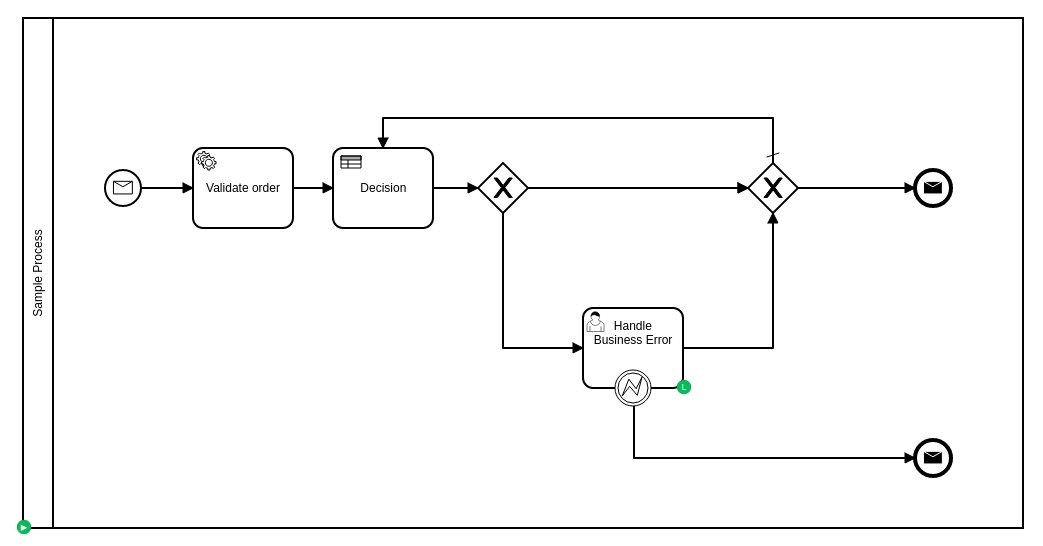
Hi @Niall , thanks for your reply. Here is a simplified version of our model. We have the user task deliberately async-before + exclusive but also when it is set as synchronous, the output is the same.
Lastly on the runtime view of the process we see no active tokens when the business error (BpmnError) is caught and the process is finished. The unexpected constellation that I posted was only visible when history view is chosen in the cockpit.
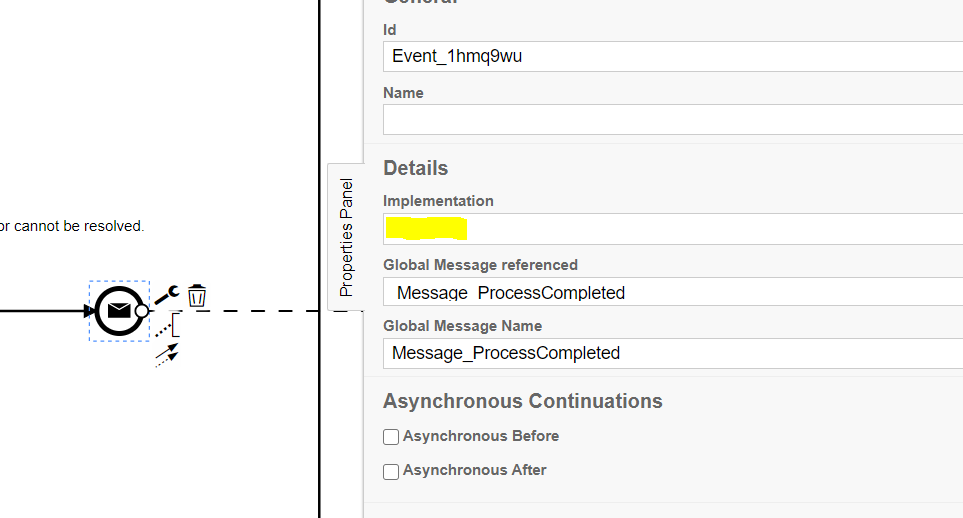
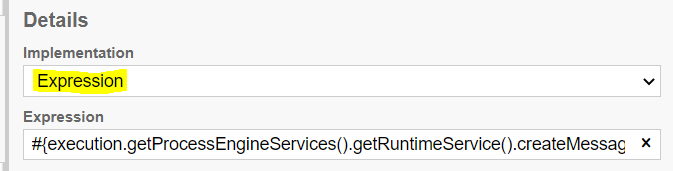
You can try below expression with implementation set to Expression #{execution.getProcessEngineServices().getRuntimeService().createMessageCorrelation("Message_ProcessCompleted").correlate()}
Thanks @hassang for your reply. I could test your idea only now. Unfortunately the problem was not solved when I introduced some implementation of the process end event. Even, when I removed the message emitter tag from the end event and run the process via boundry error, a token remained pending in the user task. As said before on the runtime view, no active tokens can be seen in the cockpit, it is as if all tokens arrived to a final state. The issue is only visible in the history view.
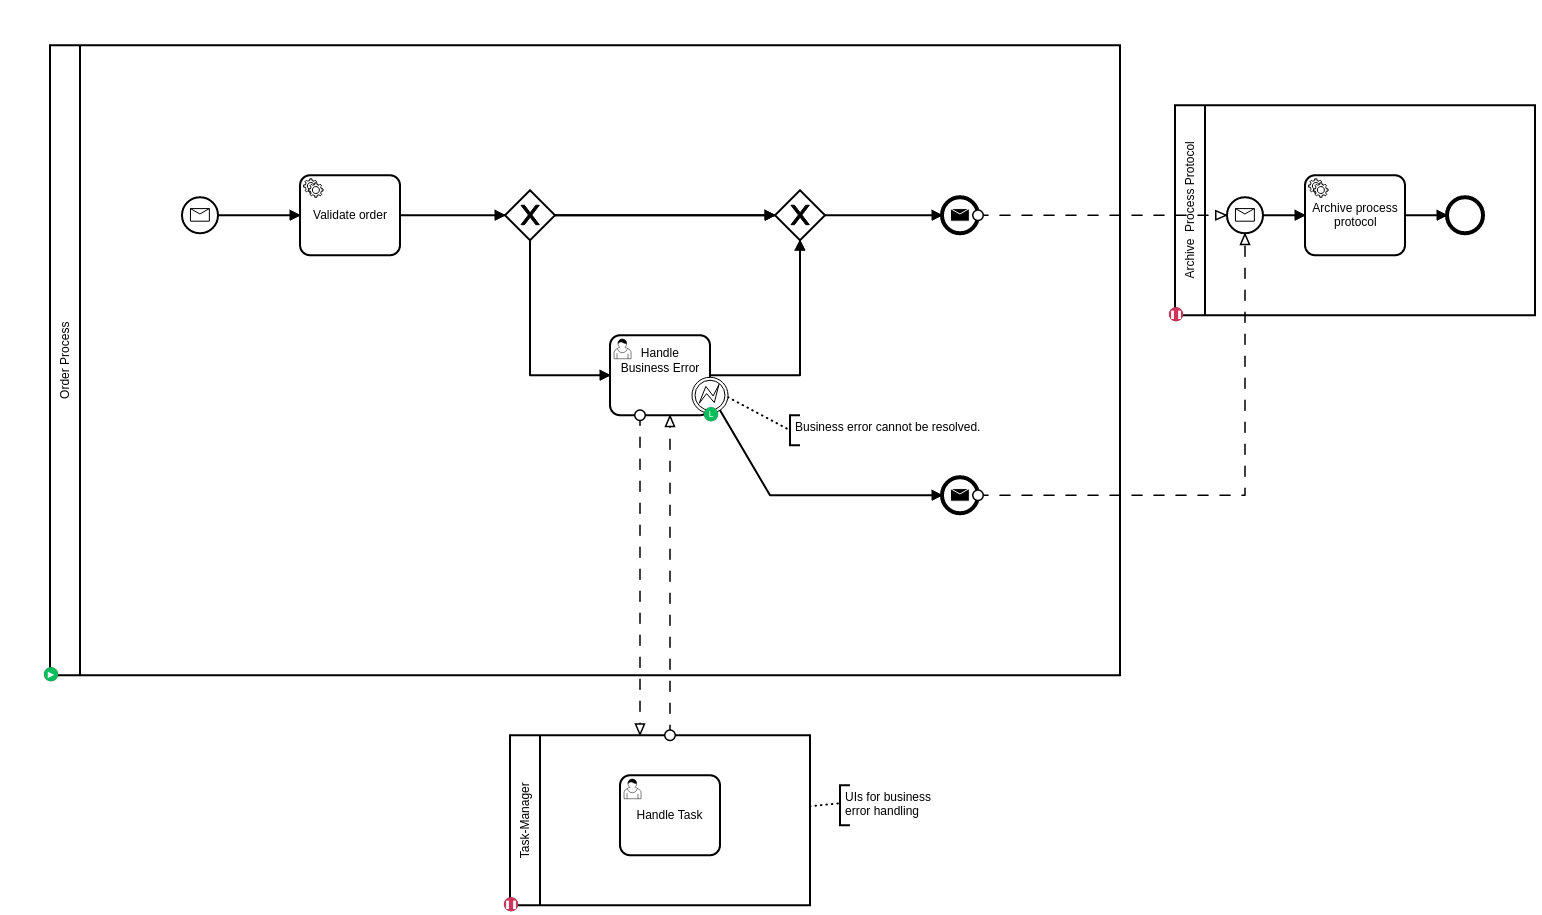
In the real process, we have a conditional loop, leading from the last exclusive-gateway to a DMN task between the service task and input exclusive-gateway. Can it be related to this? Otherwise I cannot see what may be the reason. See the attached diagram: simplified_diagram.bpmn (8.7 KB)