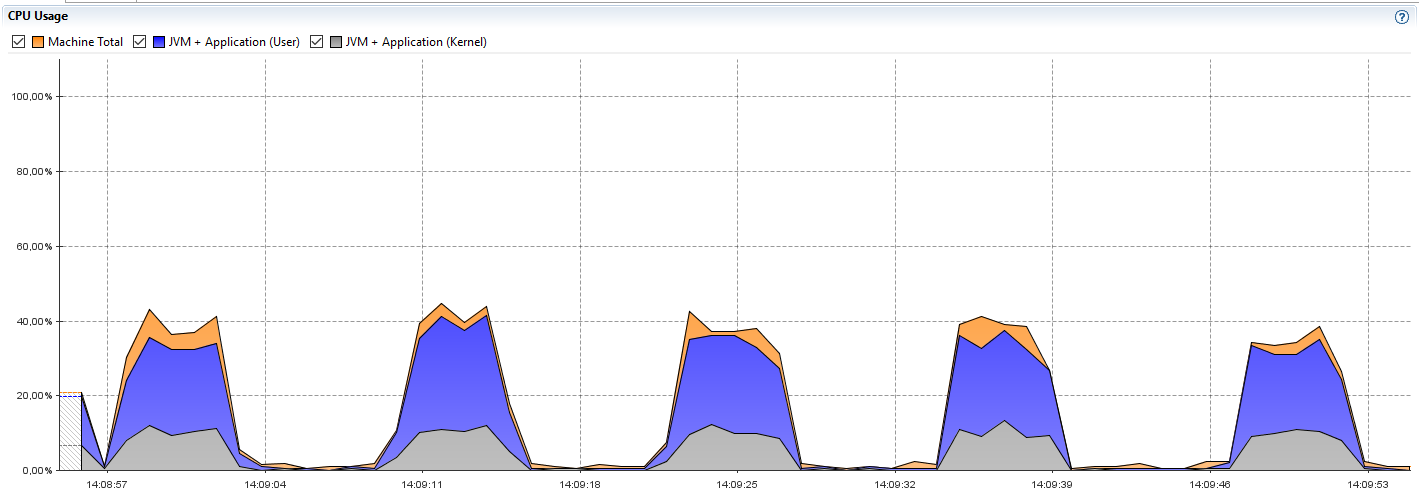
Hi. I have a business requirement to serve 50 milion process instances a day which is ~35000 instances per minute. I’m currently trying to use camunda for such business scenario. With synchronous processes there isn’t any problem - i managed to create/process nearly 250 000 instances per minute (and CPU utilization is nicely stable). But with asynchronous process (start node configured as asynchronous before) I can’t make camunda to fully utilize CPUs of nodes. CPU utilization looks like this
- the CPU is utilized in waves. At the same time, average response time for instances creating requests is 100ms, but maximum response time is 8s. It looks like the engine is short of some resources but I tried to configure what came up my mind and nothing helped. I tried to change job executor threads count, settings of job acquisition thread, DB data source connection pool size etc.
Can anybody help me with setting camunda to fully utilize physical resources? I’m sure Camunda is capable of processing such load but I need evidence 
My testing environment:
1 VM with Oracle 11g XE as engine storage
3 VMs with Camunda nodes using the same DB (40 connections for data source conn pool, 300 core pool size for job executor, job acquisition’s maxJobsPerAcquisition set to 300)
1 VM with load generator (generating REST calls to camunda nodes using round robin strategy)
Thanks a lot in advance.
Hi,
I suspect that your job executor nodes are competing to acquire jobs. In a cluster if a job executor cant claim all its desired jobs it may begin to back off.
Have a look at this blog post [1] for some more background. You may need to perform some job executor tuning…
You may also want to configure the job acquisition order if you want to minimize the maximum processing time, otherwise you may experience job starvation. See [2] for detail on setting job acquisition order. I would suggest setting it to acquire by due date.
regards
Rob
[1] https://blog.camunda.org/post/2015/09/scaling-camunda-bpm-in-cluster-job/
[2] https://docs.camunda.org/manual/7.7/user-guide/process-engine/the-job-executor/#the-job-order-of-job-acquisition
Hi Rob,
thanks a lot for your hints. However I haven’t observed any major changes in my perf test behavior and camunda nodes resources utilization respectively.
I’m currently using following config (bpm-platform.xml):
<job-executor>
  <job-acquisition name="default">
    <properties>
      <property name="maxJobsPerAcquisition">48</property>
      <property name="waitTimeInMillis">5</property>
      <property name="maxWait">50</property>
      <property name="lockTimeInMillis">5000</property>
      <property name="backoffTimeInMillis">30</property>
      <property name="maxBackoff">150</property>
    </properties>
  </job-acquisition>
  <properties>
    <!-- Note: the following properties only take effect in a Tomcat environment -->
    <property name="queueSize">100</property>
    <property name="corePoolSize">300</property>
    <property name="maxPoolSize">400</property>
    <property name="keepAliveTime">0</property>
  </properties>
</job-executor>

  <process-engine name="default">
    <job-acquisition>default</job-acquisition>
    <configuration>org.camunda.bpm.engine.impl.cfg.StandaloneProcessEngineConfiguration</configuration>
    <datasource>java:jdbc/ProcessEngine</datasource>

    <properties>
      <property name="history">none</property>
      <property name="databaseSchemaUpdate">true</property>
      <property name="authorizationEnabled">true</property>
      <property name="jobExecutorDeploymentAware">true</property>
      <property name="jobExecutorAcquireByDueDate">true</property>
    </properties>
.... some default plugins ....
</process-engine>
</bpm-platform>
Plus I configured DB connection pools sizes of each node up to up to 100. I seems none of the config changes changed the results. Still I’m able to create approximately 24000 instances per minute.
What I really don’t understand is why maximum response time rises up to 10 seconds while average is around 130ms.
Another very confusing observation for me is that when I run the test only on one Camunda nodes, the CPU valleys between high mountains are even wider. If the problem was locking in acquisition process I would expect the problem disappears when using only one node.
Output of my test utility (on three nodes):
Using threads: 50
Using delay: 10
Using runTime: 60
Url URL 1
instances count: 6708
average resp time: 182.13059033989268
max resp time: 9374
Url URL2
instances count: 6708
average resp time: 138.25014907573046
max resp time: 8309
Url URL3
instances count: 6708
average resp time: 114.92188431723315
max resp time: 8297
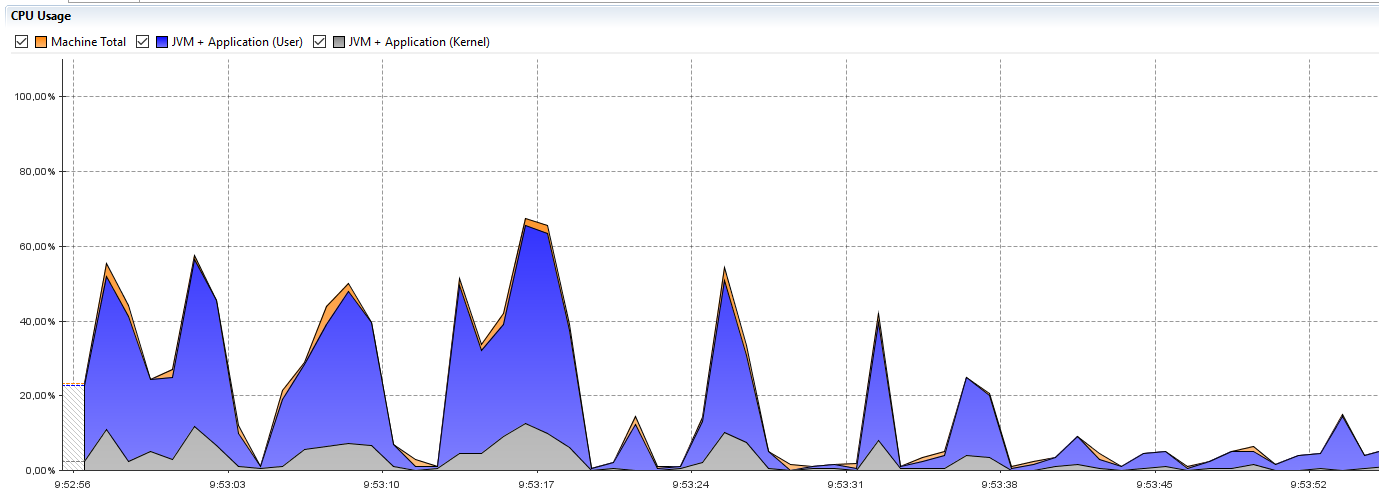
Current CPU utilization looks following (the first part with higher mountains is while the performance utility is still sending requests, the second part after time 9:53:38 is while no new requests are received - engine is only asynchronously processing the instances):
Do you have any other suggestions to make camunda nodes behave better? I’m looking for BPM tool which could perform and scale well and this is major objection for choosing Camunda at the moment.
Thanks a lot.
Jiri
Hi,
OK if you are seeing this behaviour on a single node configuration, then Id recommend performing further diagnostic and tuning on a single node cluster so that cluster effects do not pollute results.
What does your test process look like?
Do you have the one asynch continuation after the start event or are there more asynch points through the process?
Are the process tasks typically CPU intensive or IO bound with remote procedure calls?
Are you simulating the above with say using a thread sleep() call in service tasks?
These can effect your result. Consider the case if you use a sleep to simulate load. The job executor could pump enough jobs into the pool such that all pool resources are consumed. Once this occurs, the job executor will back off leading to pauses…
Some observations:
You have set core pool size to 300 threads. That is a lot of concurrent threads and you run the risk of too much context switching.
You say you have configured DB connection pool to 100 connections. Hence there could be an imbalance here in that you could have 400 (plus foreground) execution threads competing for 100 connection resources.
I also suggest you may need to have a look at your database node. It could be that the DB node is overloaded and this is leading to large pauses in your processing node. What database are you using? Is the DB on a dedicated separate node? (I recently read about a tuning exercise on MySQL where decreasing the size of the query cache made the DB faster…)
To answer your questions:
An average response time of 130ms with a max of 8000ms can be explained. Typically you will see this distribution when the arrival rate exceeds service rate. Hence the first few requests are complete very quickly whilst the last request in waits a long time as the backlog is cleared.
Given you see the CPU behaviour on a single node configuration - lets also look at the DB tier.
Next steps - can you articulate your process model, eg CPU bound or IO bound? ARe you simulating load with sleep etc…
regards
Rob
1 Like
Hi Rob,
I have been using Oracle XE database and today I switched to Oracle EE which seems to be major step forwards. Obviously the engine was waiting for DB in execution threads on XE. Now in one node scenario I can see nearly 100 CPU usage of the camunda node and 42000 created instances in minute.
When I use 3 nodes on top of one Oracle EE database, CPU utilization oscilates around 30% which indicates the nodes are really competing for the work. I will try to adjust some configs (threads, maxJobsPerAcquisition etc) and will share the results as soon as I find out the results.
Thanks.
Jiri
1 Like
I have experimented with 3 nodes and asynchronous activities in process and generally I’m concerned whether camunda is capable of acquiring and executing jobs quickly enough to process tens of thousands of instances (containing async pieces) per minute.
Are there any recommendations for such use case? I mean number of nodes and their settings (some of them dedicated only for receiving start requests and some of the dedicated only for async execution???), settings of threads dedicated for camunda job executor etc.
I expect to not use default RDB history - I plan to stream the history records somewhere into big data platform via kafka for example. The processes duration is 10 minutes in avegage, 30 mins maximum.
I created simple process depicted here:
Can somebody put recomendations for environment which would process 50 000 instances of such process in one minute?
Hi,
Another deployment patter you c an consider is you can horizontally scale your architecture including the DB tier. This works well if you can shard your domain. I believe Zalando use this approach as an example. The consequence of sharding is if you have either user tasks or inbound message correlations, its a little bit more complex. In effect you end up with ‘n’ independant stacks. Hence you need some sort of distribution mechanism to start processes. This could be as simple as round robin etc.
Given you indicate you are going to stream history, this makes it easier to use the sharding style…
Looking at your numbers, you say an average duration of 10 minutes, but you need to process 50,000 per minute. Hence do you mean an arrival rate of 50,000 per minute with a service duration of 10 minutes?
If I apply a basic erlang formula to this you end up with 500,000 concurrent process instances. Hence is this the kind of numbers you want to process? If thats the case, you may be interested in Camunda’s next generation engine see here…
This thread may also be of interest…
regards Rob
Sharding? Really? While I’m sure those folks have made it work, is that even supported? MySQL sharding, for example, requires the application itself to be aware of the sharding and to behave accordingly. I looked at sharding as a potential scaling solution (in fact, it’s the only possible one that might still preserve READ COMMITTED isolation requirements in MySQL), but rejected it because of the requirements on the application side.
We’re going to offload history to a separate database using custom Java classes and listeners. Then, the only thing the Camunda database has to do is record history at the activity level, which is only about 5% (by size of the data recorded) the size of full history. We’re still relying on a single MySQL instance, but we can scale up that server.
Camunda is very efficient in terms of handling just the processes. It’s the history that is so expensive, at least in our environment.
By sharding I mean ‘sharding’ the architecture, perhaps not sharding at the database table level. Hence you effectively run ‘n’ somewhat independant full stacks.
Even with a large DB instance, when you have lots of asynchronous continuations, contention on the job table can be a barrier to horizontal scaling of engine nodes as the nodes can compete to perform updates on a common set of rows.
A presentation on the Zalando approach can be found here…
regards
Rob
Simply said I can see two types of use cases in our business:
- “Offline” business processes which consist of automatic activities such as performing some computations, calling of external services etc. I expect requirements for 50M of such instances processed per day. The duration of each instance should be “asap” and I can see only limitation in external services response times and lack of resources for the computations.
- “Online” business processes which uses both automatic activities (external services calls again) and manual activities (human operators performing out-of-system checks etc). Maximum business peak at the moment for this scenario is around 1000 instances per minute and we can imagine 0,5M of instances per day (peaks in business hours). These online instances must be processed in average in 15 minutes. Bottleneck will obviously be the manual operators but the system must be capable of feeding operators in FIFO style (+ another complex business requirements).
These two types can be “sharded” as you suggested - performing the instances of both types in shared databases isn’t necessary. In case of type 1 I can imagine synchronous processing of whole processes which removes job acquisition contention obstacle. In case of type 2 the instances must be somehow asynchronous from principle and I’m concerned job acquisition contention might be a problem here …
Hi,
given this type of mix, you may still get away with a common single database. However you could consider having dedicated foreground versus background execution nodes. Thus consider a four node cluster with a fifth DB node. You could use two engine nodes to service the synchronous requests. Thus these nodes do not run a job executor at all. You use the other two nodes exclusively for asynch processing and no foreground processing…
In terms of job acquisition, @Thorben 's Post gives me the impression his cluster was able to acquire jobs at a rate in excess of 400 jobs/second. Even at half that rate, thats 12,000 jobs per minute.
I have direct experience of a production cluster which peaks at 30k per hour. Given each process instance is at least 3 asynch continuations, thats more like 100k executions per hour. In addition, the configuration had to be throttled back as downstream systems were becoming saturated and couldn’t keep up…
regards
Rob